
I will start this post with the new Visual Studio 2017 function, which I hope will be helpful for XAF developers too. I have both RTM and Preview versions installed, but I am mostly using the latter one for testing. The new function I spotted in their change logs is called "View decompiled source definitions instead of metadata (C#)".
As you can guess from its name, it changes the very often used "Go To Definition" command (F12) so that it displays the actual code of a C# type or member who's source code is unavailable - very useful and convenient, IMHO. It is decompiled using ILSpy, the tool I have already been using for years as default program association for opening *.dll files - partially the reason of why this news got my attention. This experimental feature is new in Visual Studio 2017 version 15.6 preview 2+ and it must be turned on explicitly using the Tools > Options > Text Editor > C# > Advanced > Enable navigation to decompiled sources menu item.

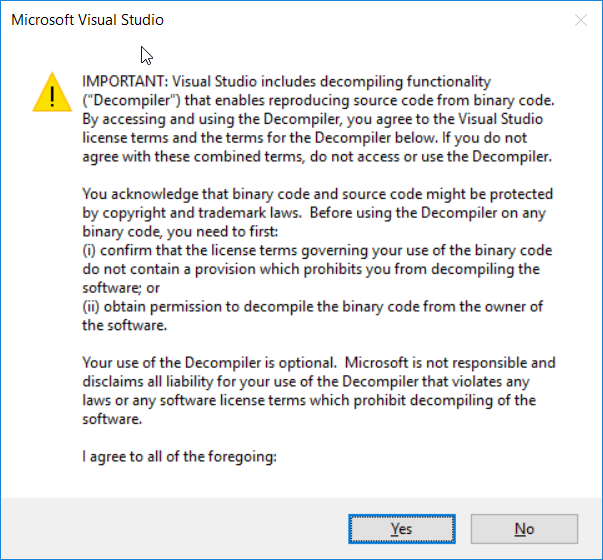
When you focus an external library API whose source code you do not own, and press F12, Visual Studio will first show a boring confirmation dialog (BTW, can it be avoided at all?):

Check out the the official docs for more details.
I am paying attention to this primarily because in my opinion, it is difficult to become a good developer quickly without reading various source code (this is not specific to XAF itself), and this new function helps on this long path.
If we talk about XAF specifically, then for certain advanced tasks like creating complex and powerful custom XAF UI elements (e.g., compared to the default ones by covered scenarios), researching and debugging the XAF source code is strongly advised for better efficiency or troubleshooting. That's because the XAF source code of standard List and Property Editors, Actions Containers, Templates and other UI elements contain dozens of perfect real-world examples and best practices to learn besides often simpler code examples in demos, support knowledge base and online documentation. Just look at "c:\Program Files (x86)\DevExpress 17.1\Components\Sources\DevExpress.ExpressApp\DevExpress.ExpressApp.Web\Editors\ASPx\" and other folders and you will see what I mean.
Practically, these examples should help you better understand how things work under the hood, remember more and more good patterns, compare your code with the best practices and spot errors, missing standard scenarios in your own implementation. For those who forgot, the DevExpress source code can also be installed by our installation, so no external tools are required to inspect it (a valid license is required, though):
Debugging the source code is also part of the same learning process and is no less important in my opinion. For this, there is a standard approach with symbols can be helpful:
How can I debug DevExpress .NET source code using PDB files. It is also no secret that there are alternative options with paid or free tools like dotPeek that can be helpful for external libraries code inspection and debugging as well. What I am describing may look too advanced for an average XAF developer, but believe me this is not rocket science and mastering those techniques can really save you a lot of time and nerves.
See Also:
eXpressApp Framework > Concepts > Debugging, Testing and Error Handling
Good write-up Dennis.
ReplyDeleteThanks, Chris!
Delete